Introduction
HighByte Intelligence Hub itself can run on minimal hardware. And depending on the data load an Intelligence Hub runtime will manage, minimal hardware may be acceptable. However, as data throughput, caching, and processing demands increase, the resource requirements for the Intelligence Hub increase as well. Naturally, this creates a balancing optimization between provisioning physical resources for data ops and tuning the Intelligence Hub to make the most of resources available.
Best Practice: Monitor Resource Usage with OpenTelemetry
Physical hardware can vary drastically based on age and architecture. Benchmarks are occasionally representative, but nothing will properly replace direct monitoring of resource utilization.
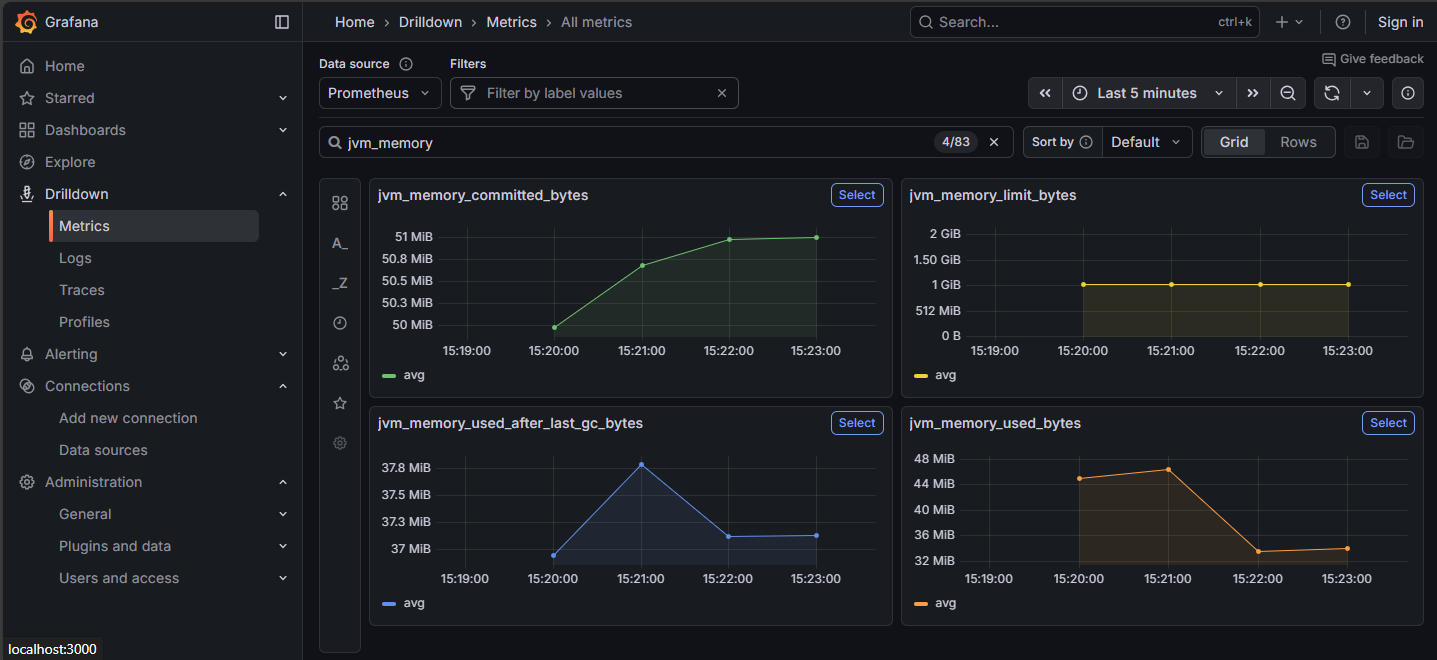
OpenTelemetry is a toolset that allows recording and visualization of critical resource data for the Intelligence Hub and the underlying resources, like memory consumption and compute time to the JVM. "jvm_memory" metrics can indicate memory issues. These metrics can also be drilled down for finer details.
Best Practice: Set Max Java Heap Memory to Half System Memory
This practice only applies to servers or virtual machines where HighByte Intelligence Hub is the predominant or singular function of the server.
Java heap memory is allocated dynamically as the JVM requires. This allocation continues up to a limit that defaults to one quarter of system memory, or is set at launch with a Java option -Xmx. In the case where Intelligence Hub is the only significant purpose of the server, this can safely be set to one half of system memory, leaving at least one gigabyte of memory.
JVM heap is not the only memory in use on the system. The JVM also has non-heap memory needs, and the operating system and other low-demand services will continue to have some memory load. But on systems of at least 2GB physical memory, '-Xmx1G' for instance, should be acceptable.
Best Practice: Set Up Memory Dumps in Case of Crash - Ensure Disk Space
As of 4.3.2, HighByte Intelligence Hub is pre-configured to create a memory dump on crash. Earlier installations of Intelligence Hub will require the following configuration.
It is recommended that memory dumps are enabled in scenarios where memory is of concern. In the event of an OutOfMemoryError, the dump may indicate the culprit system and may be crucial for troubleshooting. Ensure that adequate disk space is available on the machine to capture the physical memory installed/provisioned.
Observe High Memory-Usage Events
Some events in HighByte Intelligence Hub are especially memory-intensive. These events are not necessarily to be avoided, but can be times where bad behavior will indicate memory shortages. Observe these events for problems.
Startup
Intelligence Hub startup is very memory intensive as the entire project and supporting information is loaded into memory at the same time. Obviously, this cannot be avoided, but if problems are observed, provisioning more memory may be beneficial.
Replays
It is best practice to disable pipeline Replays in production or when not actively debugging. These Replays can capture a lot of data in memory from a pipeline run before it can be logged to disk.
State Variables, Buffers
State variables, the On Change stage, and Buffer Stages can accumulate lots of data in memory during normal pipeline operations. These are also very necessary in a wide range of data ops use cases, so they cannot be avoided, but special care should be given to ensure that unique state variables are not built per pipeline run, or that unique buffer keys are not generated per pipeline run.