Introduction
OpenTelemetry (OTel) is an open-source observability suite that provides a standard method for collecting and forwarding telemetry data from applications to observers. These resources include metrics, logs, and traces - materials often used to build out supervision dashboards.
For HighByte Intelligence Hub, OTel can collect data from several layers. Intelligence Hub provides information describing connections and pipelines. The underlying Java Virtual Machine (JVM) provides metrics from the platform, like CPU and memory usage, and then the OTel stack itself provides information describing OTel overhead. Together, these metrics can offer a comprehensive description of your Intelligence Hub runtime.
Grafana All-In-One Container
A useful OTel stack often contains several components: an OTel collector, a logging tool, a tracing tool, a metrics calculator, and a visual dashboard platform for observability. Many of these tools can be independently selected according to user needs and preferences. But for the sake of simplicity, this article will use a Grafana/OTel-lgtm (Docker Hub) image in a containerized environment. This is an all-in-one image that includes several tools to meet standard OTel requirements. The abbreviation LGTM comprises those tools:
This container is easily deployed in Docker or a preferred container engine with no need for additional orchestration. It collects data on ports 4317 and 1431, and then a user can connect to port 3000 to access the Grafana GUI dashboard.
Setting Up HighByte Intelligence Hub and Grafana/otel-lgtm
Grafana Image
Launch the Grafana image in your preferred container engine. For Docker, this command will suffice. Consider adjusting the container name or host-side ports if necessary. This will download, create, and run this container and the four tools inside listed above.
docker run -p 3000:3000 -p 4317:4317 -p 4318:4318 --name otel Grafana/otel-lgtm
For this method, that container is all that is required to install OTel tools.
HighByte Intelligence Hub
Next, we will need to start HighByte Intelligence Hub with a specific 'OTel' mode. This will tell Intelligence Hub to export data to the OTel platform, and where. By default, the 'OTel' setting will export directly to "localhost:4318" for simplicity, but it can be set to another host on the network.
To run with OTel mode, run the respective start script followed by the 'OTel <host:port>' command. Run this from the runtime directory of your installation in the command line.
For Windows:
.\start-windows.bat otel [otel endpoint]
For Linux:
./start-linux.sh otel [otel endpoint]
If running on a container local to the same host as Intelligence Hub, these commands are all functionally identical on windows:
.\start-windows.bat otel
.\start-windows.bat otel http://localhost:4318
.\start-windows.bat otel http://127.0.0.1:4318
Scripts and Services
For simplicity, a simple shell or batch script could be created in the same directory containing any of these commands to make them easier to run as a GUI user or through a service.
Windows
A simple alternative windows start script could be made in the same script directory [installLocation]/runtime/start-windows-otel.bat. This script will call the standard start script but will include the OTel option.
@echo off
setlocal enabledelayedexpansion

pushd %~dp0

title HighByte-Intelligence-Hub-OTel

.\start-windows.bat otel http://127.0.0.1:4318
To enable a service to use OTel, the file [installLocation]/runtime/service/service-controller.bat must be adjusted before creating the service. Altering the start mode of this file to point to the OTel start script above will cause the service to begin and direct OTel data to the collector. The service-installer.bat tool may then be used as normal to create the windows service.
@echo off
set mode=%1
if %mode%==start (cd ..\ && .\start-windows-otel.bat)

if %mode%==stop (cd ..\ && .\stop-windows.bat)
Linux
A simple alternative windows start script could be made in the same script directory [installLocation]/runtime/start-linux-otel.sh. This script will call the standard start script but will include the OTel option.
#!/bin/sh
./start-linux.sh otel http://127.0.0.1
A systemd service could be used to control a Linux installation of Intelligence Hub. This service would need to point to the new start script above. A simple example of this is displayed below.
[Unit]
Description=HighByte Intelligence Hub
After=network.target

[Service]
Type=exec
WorkingDirectory=/opt/highbyte/runtime/
ExecStart=/opt/highbyte/runtime/start-linux-otel.sh
ExecStop=/opt/highbyte/runtime/stop-linux.sh
ExecStop=/usr/bin/sh -c 'while kill -0 $MAINPID 2>/dev/null; do sleep 1; done'
TimeoutStopSec=15

RestartSec=10
Restart=always

[Install]
WantedBy=multi-user.target
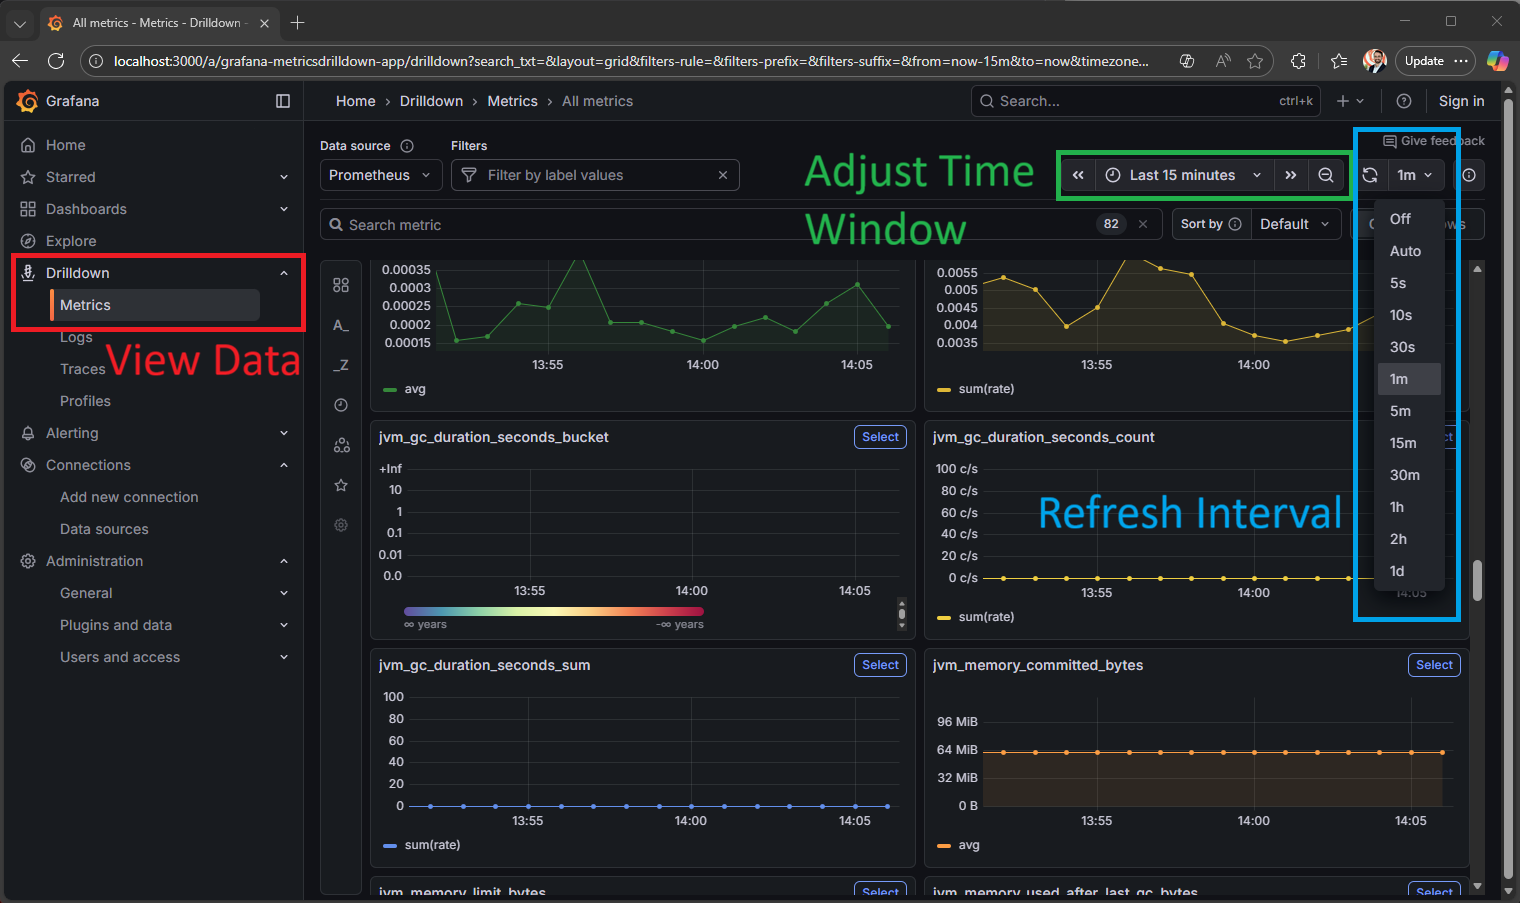
Accessing Grafana
Once running, the Grafana dashboard can be accessed at http://[host]:3000. There is no default credential or login.
- highbyte_hub_ - Collected from the HighByte Intelligence Hub application
- http_server_ - Grafana GUI server
- jvm_ - Underlying JVM running HighByte Intelligence Hub
- otel_ - OpenTelemetry processes
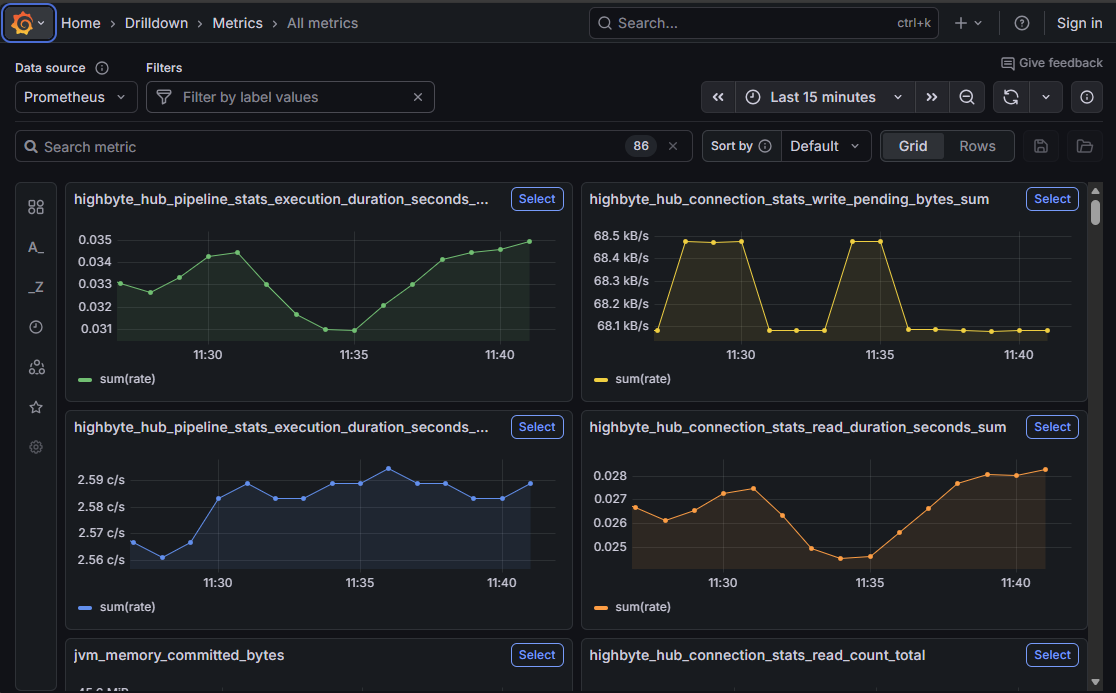
Drilldown Metrics
Grafana displays the top-level metrics of all systems as aggregates - e.g. all pipeline execution times are displayed as an average. However, metrics are collected for each instance of HighByte Intelligence Hub pointed to this OTel collector separately, as is each pipeline, connection, etc. By navigating into each of these metrics, finer metrics can be acquired through the drilldown features.
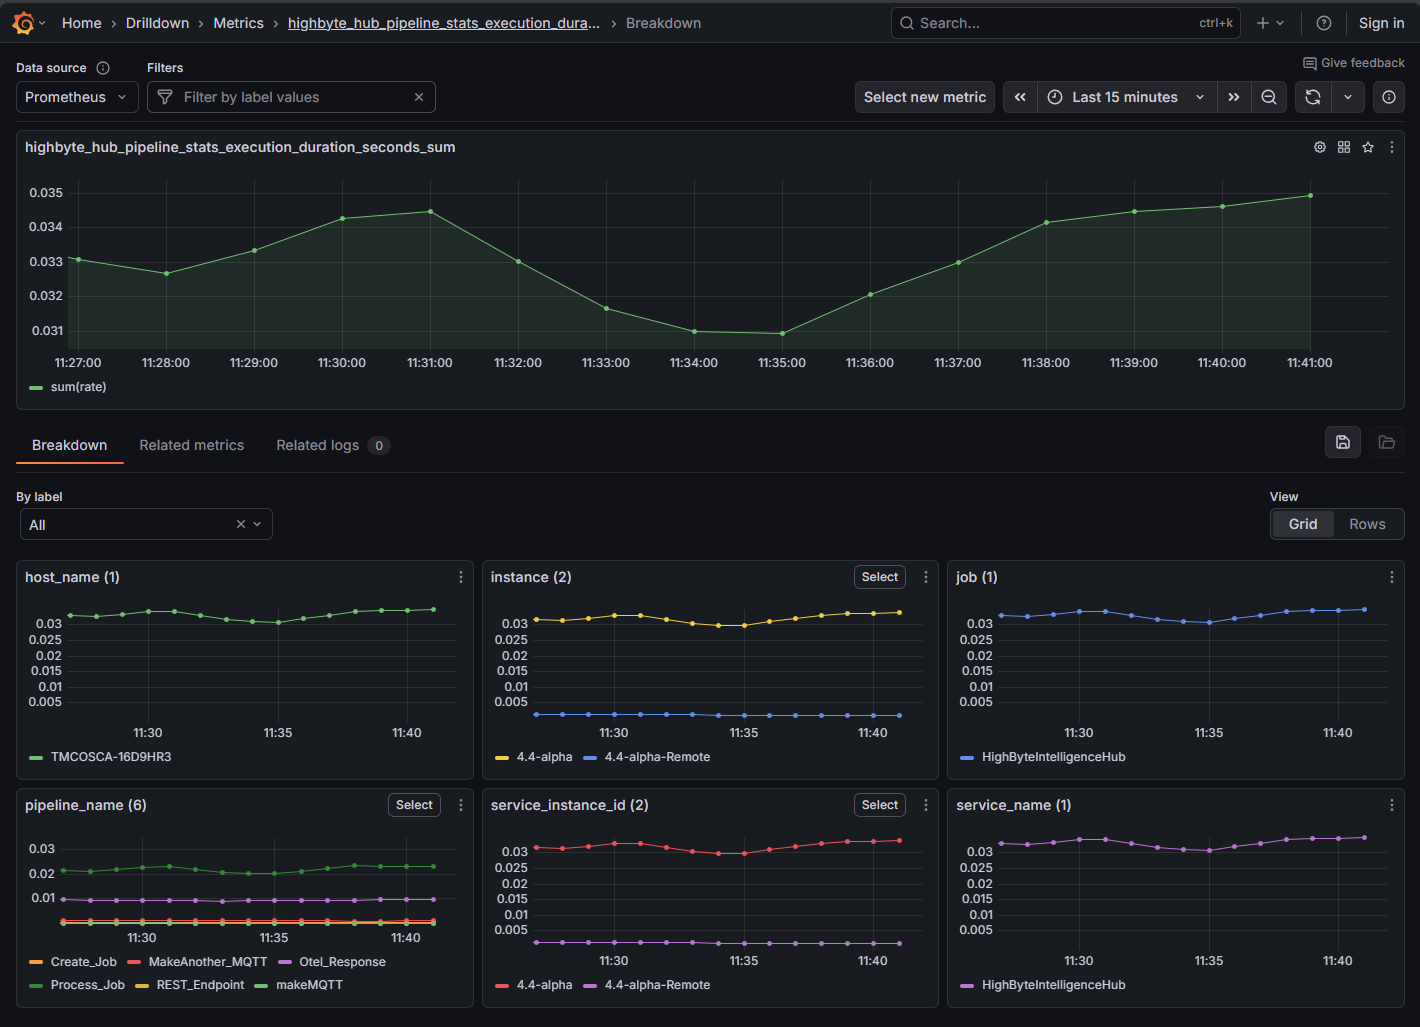
To drill down to a specific topic, find the top-level descriptive metric to be investiagted, and press the "select" button on the chart. Ofr instance, to inspect pipeline execution times, select the "highbyte_hub_pipeline_stats_execution_duration_seconds_sum" metric.
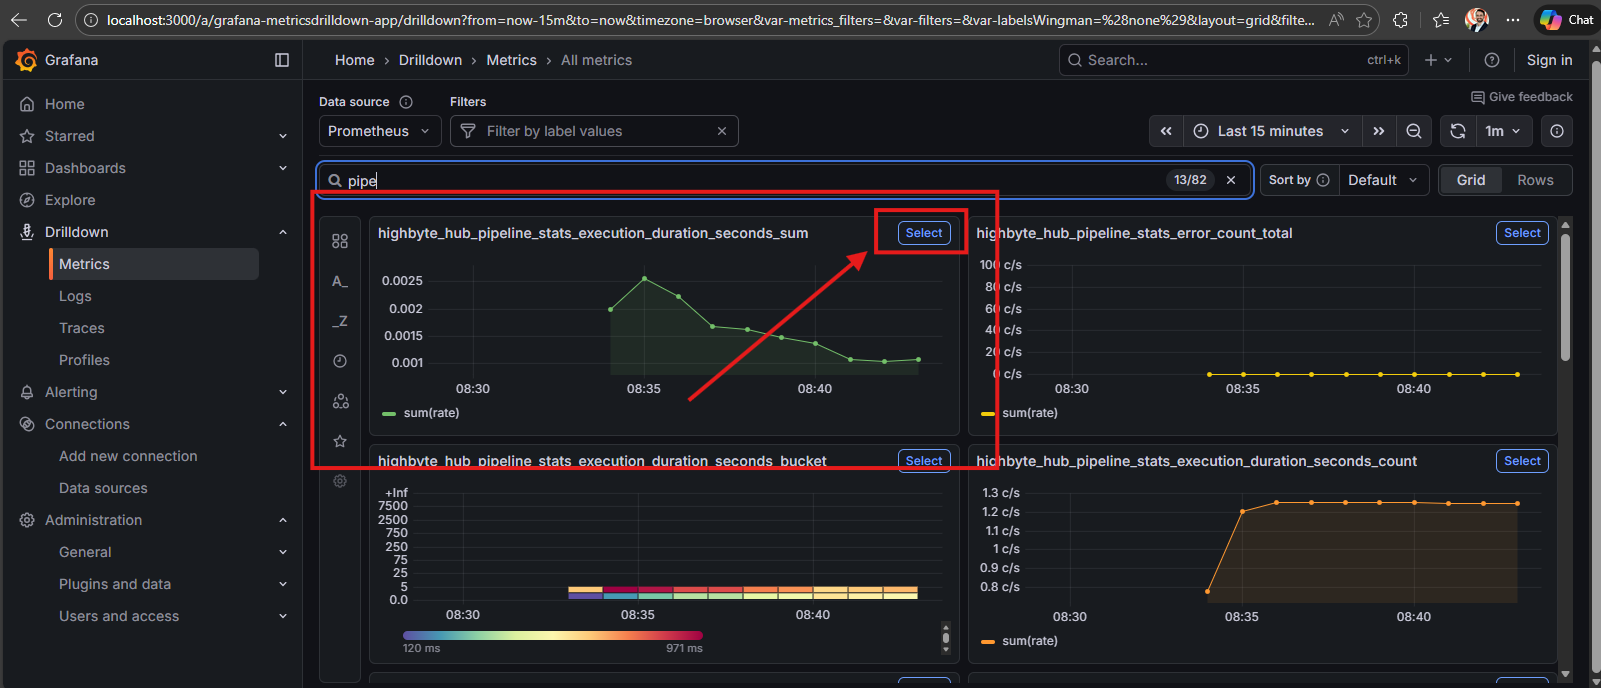
This will bring up the next level where pipeline duration could be inspected by host, service, or specific pipeline. The pictured example demonstrates an OTel collector connected to a single host. This Intelligence Hub has many pipelines, but only three are running, so OTel only displays data for the running pipelines in the display window. Selecting the further metric allows viewing of each pipeline's execution times independently.
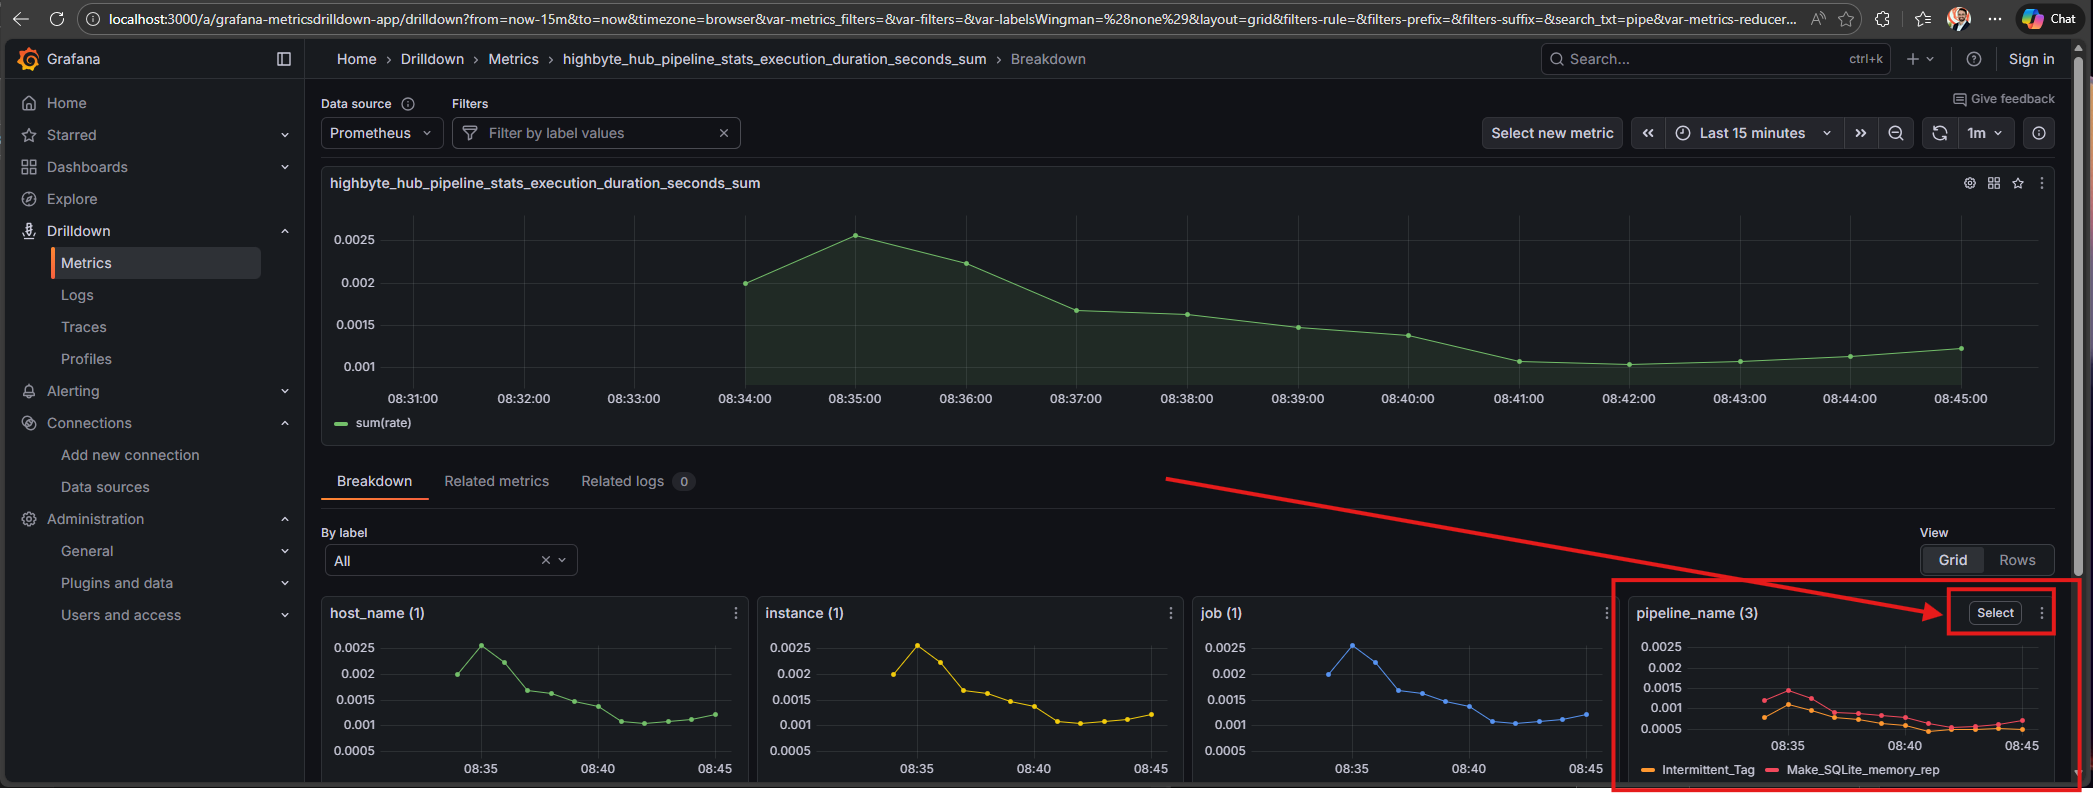
Capturing Multiple Intelligence Hubs
One instance of Grafana/otel-lgtm can host Otel data for multiple Intelligence Hub runtimes, and even other applications. These instances are all started wiht the common Otel endpoint. In addition to top-level metrics, these different applications and instances can populate topics that can be drilled down through to provide a finer view of performance. For instance, the metric highbyte_hub_pipeline_stats_execution_duration_seconds_sum shows an aggregate for all connected pipelines, but in the drilldown, individual pipelines can be observed, along with aggregates per Intelligence Hub.
Drilldown Aggregates
The available labels that can be expected are different depending on the metric, but for this example and other similar metrics that may be encountered, they are:
- host_name - the name of the host / virtual machine / computer that is running the application
- pipeline_name - the specific named pipeline running
- service_instance_id - the specific instance of Intelligence Hub or other application. This is valuable to set per-instance. By default it will be a UUID value, but may be overridden with a more practical value.
- instance - a replica of service_instance_id created by Prometheus
- service_name - the name of the application supplying the Otel data
- job - a replica of service_name created by Prometheus
Most of these labels are properly set automatically and not valuable to change. service_instance_id will be helpful to set from its default UUID format to a human-readable string. In the above image, two Intelligence Hubs are configured for Central Config, and are therefore labeled "4.4-alpha" for the central node, and "4.4-alpha-remote" for the remote node.
Setting service_instance_id
The service_instance_id label may be set by an environment variable OTEL_RESOURCE_ATTRIBUTES on launching Intelligence Hub. This could be done by adding an environment variable to the environment running the application independently or adding a line directly in the start script. If running in a container, an environment variable could be set on startup, which would be akin to the former option.
OTEL_RESOURCE_ATTRIBUTES is set to a string value that itself sets the value of service.instance.id. If adding this to a start script, it could be placed anywhere above the primary java command. Placing it immediately above the settings for other Otel variables may be a best practice.
Windows
set "OTEL_RESOURCE_ATTRIBUTES=service.instance.id=myIntelligenceHub"
Linux
OTEL_RESOURCE_ATTRIBUTES=service.instance.id=myIntelligenceHub
Docker
Set an environment variable in the docker create / run. See Docker Configuration
-e OTEL_RESOURCE_ATTRIBUTES=service.instance.id=r6