
What Does This Article Cover?
The performance of the Intelligence Hub's own Connections and Pipelines is tracked internally, and this information can be shared with outside tools so that the Intelligence Hub can be monitored on a dashboard or over MQTT. This can be done in two ways. They work differently, and the same data is not provided by both, so both are explained in this article, and the right one can be picked with the help given here.
This article covers the following.
-
What metrics are provided by the Intelligence Hub
-
The two methods by which those metrics can be shared, and how they differ
-
The full metric set being sent to Grafana using OpenTelemetry
What Metrics Does the Intelligence Hub Provide?
Two kinds of objects are reported on by the Intelligence Hub.
- Connections: the links to the devices and systems on your plant floor. For example, an MQTT server, an OPC UA server, or a SQL database. For each Connection, how many reads and writes happen, how long they take, how many fail, and whether the Connection is healthy are all tracked by the Intelligence Hub.
- Pipelines: the flows by which data is moved and shaped inside the Intelligence Hub. For each Pipeline, how many times the pipeline was run, how long it took, and how many errors occurred are tracked by the Intelligence Hub.
Both connection read and write metrics are provided by the product, so if these are being looked into, the one that can be used is determined by the method that is chosen.
What Are the Two Methods, and How Do They Differ?
1. OpenTelemetry (OTel).
OpenTelemetry is an open and popular standard by which an application's metrics and logs are sent to a monitoring tool. The Intelligence Hub can be started in an "OTel" mode by which its metrics are pushed out to a monitoring system. The full set of connection metrics, including both read and write, is provided by this method. It should be used when the destination is a monitoring platform such as Grafana.
2. System References
The status and statistics of each Connection and Pipeline can be exposed by the Intelligence Hub as internal source data, which means it can be read inside a Pipeline the same way a value is read from a device, and then written wherever you like. This should be used when the data is wanted on MQTT, in a database, or behind the REST Data Server. A connection status and write-side statistics are provided by this method, but the detailed read metrics are not.
3. The Table Below Shows The Key Differences
| OpenTelemetry | System References | |
|
How the data leaves the Hub |
Send out to a secondary monitoring system / collector | Read inside a Pipeline, and then written to any Output |
| Best for | Grafana and other monitoring platforms | MQTT, a database, or REST Data Server |
| Connection read metrics | Yes | No |
| Connection write metrics | Yes (count, errors, duration, dropped writes, pending) | Write queue only (Pending, dropped, per-output, total size) |
| Connection status and health | N/A | Yes |
| Pipeline metrics | Yes | Yes |
If detailed read metrics are needed, OpenTelemetry must be used, but if the connection status and write-queue statistics are enough, then those could be sent to MQTT, a database, or the REST Data Server by using the system references.
Send the Full Metric Set to Grafana Using OpenTelemetry
The OpenTelemetry Java Agent can be run built-in by the Intelligence Hub start scripts. When it is started in "otel" mode, the Intelligence Hub's metrics and event logs will be sent to a collector, and from there they are read by a monitoring tool such as Grafana. A collector is simply the receiver by which the incoming data is listened for.
What you get. All metrics are named under [highbyte.hub.*]. The connection read and write metrics are listed below. "Counter" means a running total by which only upward movement is made, like the total number of reads.
For a complete worked example in which an all-in-one Grafana container is used, one that can be put in your start script and pointed at the Intelligence Hub, the following linked Knowledge Base article can be consulted here.
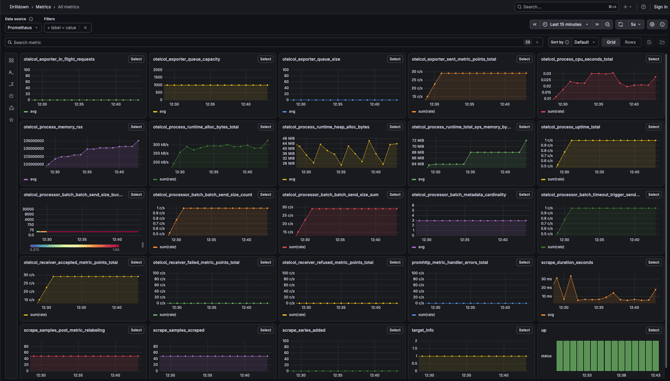
Sending Metrics
Each Connection's status and statistics are exposed by the Intelligence Hub as source data under the reference Systems.Connections. . Because this is source data, it can be read in a Pipeline and written to any Output. One caveat is that no read metrics are included here, since the reference only provides connection status and write-side statistics. For read counts, read durations, or read errors, OTel should be used instead.