What Does This Article Cover?
- What is a Pipeline?
- Pipeline Stages
- Additional Pipeline Features
- Pipeline considerations
- Sample Project
- Other Related Material
What is a Pipeline?
Pipelines consist of multiple stages that manage data flow from the initial trigger through various transformations to the final destination. These stages work together to ensure efficient data processing and transfer from source to target. A Pipeline includes stages that can trigger, buffer, transform, and format data from any source before writing it to targets. This modular approach provides both flexibility and scalability, enabling the pipeline to manage various data types, structures, and processing requirements. By breaking down data processing into distinct stages, pipelines can be easily configured and adjusted for various applications, including real-time data processing, batch processing, and complex data transformations.
When data is written to the Pipeline, the pipeline propagates the value and accompanying metadata to each pipeline stage. Each stage executes against the event and transmits the event to the next stage(s).
Pipeline Stages
This section details all the stages that can be utilized in Pipelines along with their configurations.
Trigger Stages: Triggers can be configured to activate pipelines based on conditions such as receiving an MQTT message or an event from an OPC UA source. Supported trigger types include:
- Event Trigger: Reacts to incoming data from an event (list event types here) and initiates the pipeline.
- Polled Trigger: Configured to collect data at regular intervals from a source
- Flow Trigger : A flow trigger designed for the migration of version 3 configurations. The advantages of using a flow trigger is that it supports multiple source references for a pipeline. When multiple sources are used in a flow trigger, the pipeline will not wait for each source to complete its read before firing.
- Execution Types:
- Polled : Operates on an interval basis
- Event Based: Executes when a new event occurs.
- Execution Types:
-
- Flow Execution Mode
- Always: This mode ensures that the Flow will execute at each specified interval, regardless of whether there have been any changes in the data source. Use this when you want consistent and continuous data transfer.
- On Change: Here, the Flow triggers only when there is a change from the previous reading. This mode is efficient when you only need updates when actual changes occur.
- On True: The Flow is executed when a specified expression transitions from false to true. This can be useful when you want the Flow to act upon a particular event or threshold being reached, like a temperature surpassing a certain limit.
- While True: In this mode, the Flow keeps executing as long as a certain condition remains true. For example, if you want continuous data transfer while temperature is above a certain threshold, this mode would be appropriate.
- Note: When On Change, On True, or While True is selected, an Expression box will appear. This expression will be evaluated by the 'Flow Mode'.
- Publish Mode: Defines how the data from your source will be sent to the target system. Consider your data's nature and the frequency of changes to determine the best fit
- All Values: With this mode, all successfully read data values are sent at each interval. This ensures that the target receives comprehensive data but might send redundant information if values haven't changed.
- Only Changes: This mode will transmit only the data values that have altered since the last interval. It's an efficient choice when you want to minimize data traffic and only focus on changes.
- Only Changes Compressed: Similar to the "Only Changes" mode, but even more streamlined. Here, for modeled instances, only the specific attributes that have changed are transmitted. It ensures the leanest data package while still capturing changes.
- Trigger Delay
- This is applicable when the Flow Trigger is in Event Mode. It represents the waiting time from Event Source/Expression evaluation to reading source data
- Flow Execution Mode
Start Stage: This stage comes default on all pipelines. It is used to separate the trigger stages from the processing stages of the pipeline.
Typically, when using a Polled or Event trigger, the stage following the start stage will need to be a read stage. This read stage is crucial as it serves as the initial point of data intake, ensuring that the pipeline has the necessary information to process. The read stage can either read from a connection input, which involves fetching raw data directly from an external source such as a database, API, or sensor. Once the data is read, it can be followed by a model stage to structure the data, mapping it to a predefined schema or format that aligns with the pipeline's requirements. Alternatively, the read stage can read an instance of already modeled data, which means it retrieves data that has been previously structured and formatted, ready for further processing or transformation within the pipeline. This flexibility allows the pipeline to handle various data sources and formats efficiently, ensuring that the subsequent stages can operate on well-defined and organized data.
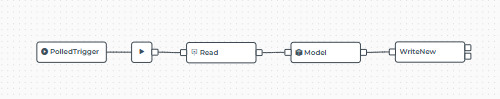
Simple Polled Pipeline Example:
Common Stages
- Breakup: The Breakup stage is used to split complex data structures, like arrays or objects, into simpler, individual components. This is particularly useful when you need to handle or process each element separately within the pipeline.
- Breakup Type:
- Array: When the data is an array, this option will break the array into individual elements, each of which can be processed separately in the pipeline.
- Object: For object data structures, the breakup will separate the object into key-value pairs, allowing each key-value pair to be processed independently.
- All: This option applies the breakup to all elements within the data structure, whether they are arrays, objects, or nested combinations of both, ensuring that every component is handled individually.
- Breakup Type:
- Filter: The Filter stage allows you to pass only specific data through the pipeline based on defined criteria. It acts as a gatekeeper, ensuring that only data that meets certain conditions is processed further. This stage can be used to exclude unnecessary or irrelevant data.
- Filter Option:
- Include : Filters attributes will be included in the payload
- Exclude: Filtered attributes will be excluded from the payload
- Retain As Metadata
- Values removed from the payload will be retained as metadata.
- Using the Filter stage with the exclude option and the retain as metadata flag is an efficient method to transfer values from your payload into metadata. This approach ensures that while the specified data is excluded from the main payload, it is still preserved as metadata for further use. This can be particularly useful in scenarios where you need to keep track of certain data attributes without including them in the primary data flow, allowing for more streamlined and efficient data processing.
- Filter Option:
- Flatten: The Flatten stage is designed to take nested data structures and simplify them by flattening them into a single-level structure. This stage is particularly useful when dealing with hierarchical or nested data formats that need to be converted into a simpler form for further processing or analysis.
- Delimiter: The delimiter is a character or sequence of characters used to separate the attributes in the flattened object. When flattening a nested data structure, the delimiter is inserted between the attribute names to create a unique path for each value in the flattened object. For example, in the flatten operation shown above, the "/" character is used as the delimiter. This results in a flat structure where each nested path is represented as a single key, like
"machine/sensor1/v1". You can customize the delimiter based on your needs, such as using a period (.), hyphen (-), or any other character that suits your data formatting requirements.
- Delimiter: The delimiter is a character or sequence of characters used to separate the attributes in the flattened object. When flattening a nested data structure, the delimiter is inserted between the attribute names to create a unique path for each value in the flattened object. For example, in the flatten operation shown above, the "/" character is used as the delimiter. This results in a flat structure where each nested path is represented as a single key, like
- Model: The Model stage reshapes event data according to a defined model structure, without needing an instance. It maps incoming data to model attributes and can perform calculations or set variables through an initialization block, which are then used in attribute expressions. This stage is ideal for standardizing data format within the pipeline, especially when handling data that needs consistent structuring before further processing or output.
- Model: The model defines the structure of the event data. After setting it, click the "Configure Attributes" button to open the model definition and map the event data to its respective attributes.
- Object Name: The name given to the event after it has been restructured. This is similar to an instance name and fills the _name metadata.
- Initialization Block: This section is used to define variables or perform calculations that can be reused across multiple attribute expressions. For instance, you might calculate a setpoint temperature once and then reference it in multiple places within your model.
- Configuring Attributes:By choosing "Configure Attributes," you can determine how each attribute in your model will be populated with event data. This process uses a user interface similar to the instance view, making it easy to navigate if you're already familiar with instances. In this interface, you can employ JavaScript expressions to define how each attribute is calculated or assigned based on the event data. If an expression fails or is not provided, a default value will be used to ensure the attribute is correctly populated.
- Model Validation: The Model Validation stage is used to verify that event data conforms to a predefined model structure before it proceeds further in the pipeline. This validation ensures that data adheres to specific requirements, such as data types and required attributes, making it crucial when sending data to a data lake or another consumer that demands strict data integrity.
- Model: This option allows you to select the model against which the event data will be validated. The validation process checks each attribute against the model’s definition without performing any type casting. For instance, if an attribute value is a string like
"123"but the model expects an integer, the validation will fail. Additionally, attribute names are case-sensitive, and the model’s default values are applied if an attribute is missing in the event data. - Additional Properties: This setting controls whether the presence of extra attributes in the event data—attributes not defined in the model—should cause the validation to fail. Depending on your use case, you might allow additional properties to pass through, or you might enforce strict conformity to the model.
- Model: This option allows you to select the model against which the event data will be validated. The validation process checks each attribute against the model’s definition without performing any type casting. For instance, if an attribute value is a string like
- Size Buffer: Buffers data until a specified size is reached, then sends the data as a batch. This stage is particularly useful when dealing with data that is transmitted in chunks.
- Time Buffer: Similar to the Size Buffer stage, but buffers data based on time intervals instead of size. It accumulates data over a set period and then processes or sends it as a group.
- Transform: The Transform stage is used to apply complex transformations to event data using JavaScript expressions. This stage allows you to modify the event's value, extract and create metadata, extract and create state variables, or incorporate additional information into the data as it moves through the pipeline. It offers powerful capabilities to reshape and adjust data in real-time, making it an essential tool for pipelines that require advanced data manipulation beyond simple mapping or filtering. While the Intelligence Hub provides many built in stages for your needs, think of the transform stage as your Swiss-army knife for complex transformations and data manipulation.
In Intelligence Hub version 4.3.0, the "Transform" stage was renamed to the "JavaScript" stage.
Control Stages
- On Change: This stage ensures that only data that has changed since the last event is passed through. It's useful for minimizing data traffic by only transmitting updates.
- Switch: The Switch stage routes data to different stages based on conditional expressions. It’s akin to a switch-case logic structure found in programming, allowing for branching paths within the pipeline.
File Format Stages
- CSV: The CSV stage converts the event data into a CSV (Comma-Separated Values) file format.
- GZIp: The GZip stage compresses the event data using the GZip algorithm. This is particularly useful for reducing the size of large datasets before they are transmitted or stored, saving bandwidth and storage space.
- JSON: The JSON stage is used to convert event data into a JSON file format. JSON is widely used for APIs and data exchange due to its lightweight and flexible nature.
- Parquet: Converts event data into the Parquet file format, a columnar storage format optimized for efficient reading and writing of large datasets, often used in big data environments.
- Zip: The Zip stage bundles event data into a ZIP archive. This is useful when you need to compress and package multiple files together before transmission or storage.
I/O Stages
I/O Stages: Generally, pipelines conclude with an I/O Stage. Specifically, a 'Write' or a 'Write New' stage where pipeline data is sent to a target destination.
- Read: The Read stage is used to retrieve data from a specified input.
- Write: The Write stage sends processed data to a designated output destination.
- Write New: Similar to the Write stage, the Write New stage outputs data to a specified destination. However, it is specifically designed for creating new outputs for a connection rather sending to an existing output. This is helpful when you want to output dynamically
- Smart Query: The Smart Query Stage is utilized to access the Namespace. This stage allows you to query either the entire namespace or specific parts of it, apply filters, and transform the outputs to facilitate pipeline processing. It employs JSONata syntax for querying the namespace.
Additional Features in Pipelines
- Tracking and Replay
- Pipelines offer built-in tracking and replay capabilities. This allows you to monitor the data flow and debug any potential issues. You can review the timing of each step and replay pipeline executions to understand how data was processed at any given time.
- To enable replay, in the top navigation bar click the pipeline name and toggle the "Track Activity" switch. Then select the "Replay" menu item. From here you can select a replay.
- Statistics
- Pipelines offer comprehensive statistics on processing performance, both for the entire pipeline and for individual stages. These statistics encompass a range of metrics such as execution time, number of runs, errors, and waiting time for the pipeline.
- Please be aware that saving or modifying your pipeline, or toggling it off and on, will reset the statistics.
- When you click the 'start' stage outside of a replay, it displays the pipeline's statistics for the duration of the run in its present configuration. Likewise, selecting an individual stage when not in a replay will show the statistics for that stage over the run's duration in its current configuration.
Pipeline considerations
- “Track Events” adds to the compute resource load, it should only be enabled when troubleshooting.
- When testing new Stages, consider adding a Write New Stage to output each stage results to a test topic within the Intelligence Hub’s local broker.
- Truncated Data
- Should a value surpass 8,000 characters, a notification will appear during a replay attempt. The Intelligence Hub may only show the initial 8,000 characters of a value owing to browser limitations, but rest assured that the entire payload circulates within the software's backend. Payloads are never reduced in size.
- When setting up a transform stage, you can record various values within the transformation by utilizing console.log or write to the event log.
Sample Pipeline
A sample project is included. Using this project, we will walk you through create a pipeline and send OPC UA data to MQTT using the pipeline wizard .
Sample Project Download
- Upload Project
- Upload it to your Intelligence Hub Instance by clicking 'Project'.
- Select Import Type to "JSON", paste the code below and click 'Import'
- Enable the MQTT Broker
- In the left-hand navigation panel, navigate to Manage, and click Settings
- Under the MQTT Broker section enable the broker, if ports 1885 and 1886 are being utilized on your Intelligence Hub server, update to ports of your choosing, otherwise accept the defaults and click save.
- If you need to change the ports adjust them in the Tutorial_MQTT connection. *trying to make this a callout, not working *
- Setup the UNS Client
- In the left-hand navigation panel, navigate to Tools and right click UNS client and open Link in New Tab
- Enter login information
- For Connection select Tutorial_MQTT
- Click Add
- Click Connect and confirm UNS client says “Connected to Tutorial_MQTT”
- Return to the previous tab
- Make note of the 'CNC_Asset_Info' Instance
- Click on Instances and then click on 'CNC_Asset_Info'
- Note that this Instance comprises 7 attributes. While all attributes originate from the Tutorial_OPC_UA connection, some are singular tag inputs, and others reference tags within a collection. The tags derived from the collection use the 'expression' expression type to execute JavaScript to extract the specific value from the input that needs to be inserted into the attribute.
- Test Instance
- In the left nav under 'Configure' select 'Connections'
- Choose 'Tutorial_MQTT'. Go to 'Outputs' and select the 'Tutorial_First_Output'.
- Note that the Topic for the output is 'Tutorial/FirstOutput'
- Create the Pipeline with the Wizard - Part 1 - Details
-
- In the left hand Navigation Panel, navigate to Pipelines and click 'New Pipeline'
- In the name field enter "First_Pipeline"
- Leave 'Description', 'Tags' and 'Group As' blank
- Select "Build Flow' to utilize the Wizard

- Click 'Next'.
-
- Create the Pipeline with the Wizard - Part 2 - Sources & Targets
- In this next screen we will add Source and Target references.
- Setting Source
- Using the Reference Panel on the right hand side set Type to Instance and drag the CNC_Asset_Info_Instance into the 'Sources; field
- Setting Target
- Using the Reference Panel on the right hand side set:
- Type to Output
- Connection to 'Tutorial_MQTT'
- Then drag the Tutorial_First_Output to the 'Targets' field

- Click Next
- Using the Reference Panel on the right hand side set:
- Create the Pipeline with the Wizard - Part 3 - Trigger
- In this last screen in the wizard we will determine how we want our flow to trigger
- For demonstration purposes we will set:
- Execution type to Polled
- Interval to 2 Seconds
- Mode to Always
- Click "Create"
- Enable the Pipeline
- After clicking the create pipeline you will land in the pipeline view with a complete pipeline using a Flow Trigger stage.
- By default the pipeline will be disabled. To enable it click on the Flow Trigger stage. In the right hand side in the selection panel enable the flow.
- When the flow is enabled
- View Data in the UNS
- Switch your browser tab to the one you opened your UNS in. You should see Tutorial/FirstOuput path with the Instance payload

- Switch your browser tab to the one you opened your UNS in. You should see Tutorial/FirstOuput path with the Instance payload